
Javsacript Graphing Libraries
Interactive Charts & Graphs
Graphs and Charts are a wonderful way to display, explain, understand, and analyze data. They provide not only attractive imagery for your design, but explanations of, at times complicated, information and relationships.
Websites provide the opportunity to create interactive graphs that respond to your users, as opposed to simple image graphs on paper. Here are some JavaScript libraries for creating both traditional line, bar, radar, polar, pie, doughnut, area, and polar area graphs, as well as timelines and node graphs.
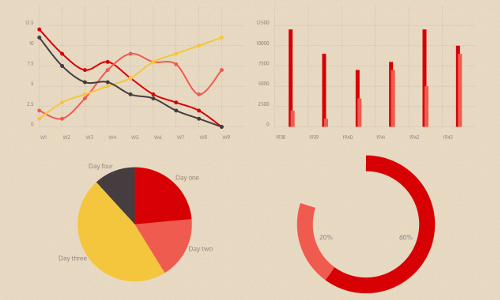
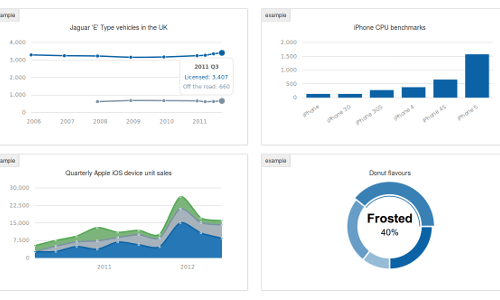
Chart.js
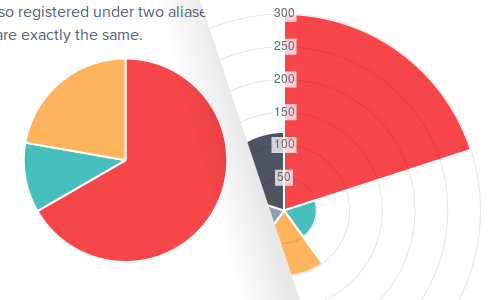
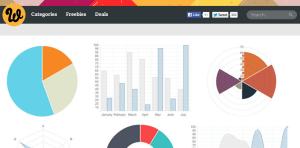
Chart.js is a JavaScript graphing library designed for adding dynamic graphs to websites quickly and easily. The library supports creating: line charts, bar charts, radar, charts, polar charts, pie charts, and doughnut charts.
Chart.js creates graphs on websites using the HTML5 canvas element. The graphs can be animated and interactive, supporting tool tips and other elements. Continue reading…
Easily create stunning animated charts with Chart.js
A well-explained tutorial, this article details how to make a line chart, a pie chart, and a bar chart with Chart.js. The code is clean and understandable, and the text does a good job of explaining what the code does.
Build a Dynamic Dashboard With ChartJS
This Chart.js tutorial is detailed and well explained. It shows how to create a doughnut graph, a line graph, and a radar graph, as well as explains a bit about how Chart.js works. This tutorial does a good job of explaining the code used additional to Chart.js, such as defining labels for the doughnut graph.
Chart.js library simplifies adding charts to web applications
This article introduces Chart.js and briefly explains how to create a simple bar graph. It also gives a brief explanation of how Chart.js works and how to add it to a webpage.

Getting started with Chart.js
This relatively straightforward tutorial explains a practical example of how Chart.js can be used. The tutorial, from June 2013, creates a simple graph of website rankings from Alexa. The code is bulky, but it is understandable and builds a useful graph.
Chartist.js is a JavaScript-based graphing library for websites. The library creates graphs real-time on websites with scalable vector graphics (SVG), styles them with CSS including CSS animations and transitions, and gives direct control of the graphs with JavaScript.
Because graphs built by Chartist.js are created using vectors, they are fully responsive to your visitors’ screen sizes and will automatically match your visitors’ screen resolution. Continue reading…
Chartist.js Tutorials: Creating Line, Bar, Scatter, and Pie Charts
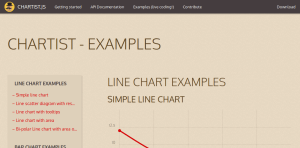
Chartist – Examples
This pages shows live demos for how to create charts with Chartist.js, providing javascript code and brief explanations for the end result. The examples include line charts, scatter charts, area charts, bar charts, and pie charts.
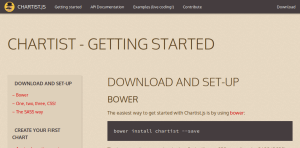
Chartist – Getting started
This is the official tutorial for Chartist.js. It explains how to load the library, how to create the HTML structure for graphs and charts in the page, and the javascript for creating charts. The tutorial is easy to follow and quite understandable, with clear explanations for potential developers about how the library works.
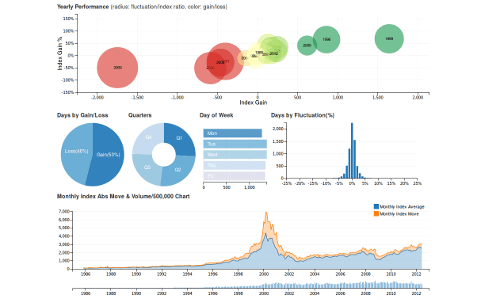
DC.js is a JavaScript library for creating Multi-Dimensional charts and graphs.
DC.js is built using d3.js, a JavaScript 3-dimensional graphing and rendering library, and crossfilter.js, a library used to examine and process large, multi-variate data sets. Continue reading…
DC.js Tutorials: Creating Dynamic and Interactive Line, Bar and Doughnut Charts
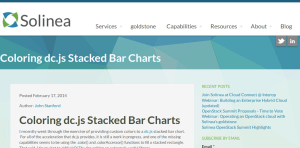
Coloring dc.js Stacked Bar Charts
This tutorial shows how to create a single stacked-bar graph using DC.js. It shows how to color the data components of the graph both using javsacript and using CSS3 nth-child selectors.
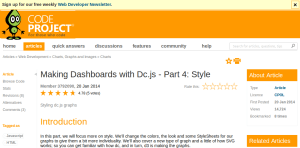
Making Dashboards with Dc.js
This in-depth tutorial demonstrates how to use DC.js to create a web-based dashboard, similar to many intranet sites. Since DC.js is inherently a complex and highly-featured library, the tutorial is long and intricate. However, the tutorial does a great job of explaining how the page in the tutorial is built and what the code does. It shows how to add the code and data, as well as how to customize the appearance of the graphs.
Morris.js is a graphing library designed for creating line graphs, bar graphs, area graphs, and doughnut graphs. It is designed to help you build charts and graphs quickly and efficiently. Morris.js supports both adding data through Google spreadsheets, creating graphs similar in appearance to Google Charts, and directly adding data through JavaScript on your website. Continue reading…
Morris.js Tutorials: Creating Line and Bar Charts
Creating bar graphs with AJAX and Morris library
This tutorial shows how to create charts with content dynamically loaded using AJAX. It shows how to write the AJAX, set up the charts with Morris.js, and how to use the data with the charts.
Creating Line Chart Using Morris.js
This tutorial shows how to create line charts with Morris.js. The article divides the process into components: first including the dependencies, then the HTML/PHP, next the CSS, then the javascript to create the charts, and finally the JSON-structured data. The tutorial is well structured and the code is briefly explained.
Timeline.js helps you create beautiful, interactive, easy-to-use timelines for your website. This library will help you tell, illustrate, or support stories that are strongly based on time with a series of events.
Timeline.js allows you to easily add information quickly from a number of sources, including tweets from Twitter, videos from YouTube and Vimeo, images from Flickr, maps and location information from Google Maps, and audio from SoundCloud. The library will also help you add text from Wikipedia, as well as information from Vine and Dailymotion. Continue reading…
Timeline.js Tutorials: Creating Beautiful, Interactive Timelines
TimelineJS – Build Beautiful Timelines
This tutorial gives examples of code to use to build a timeline with Timeline.js. It shows how to build the timeline with JSON-formatted data data, and how to add the timeline into a HTML page.
Customized timeline with Timeline.js
This introductory tutorial shows how to add and embed a timeline on a webpage with Timeline.js. It briefly explains the directory structure of the Timeline.js library, and how to use it when hosted on your web server.

Timeline Portfolio
This tutorial explains in detail how to create a timeline using Timeline.js. Aimed for people creating a timeline for their work or experience, it explains the HTML structure of a page using the library, then details how to customize the timeline’s appearance with CSS.
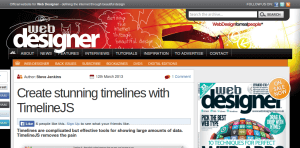
Create stunning timelines with TimelineJS
This in-depth tutorial explains how to set up a timeline with Timeline.js. It briefly explains how to obtain the library and add it to a website, then details step-by-step how to add content to the timeline using JSON-structured data, loaded in-page using javascript.
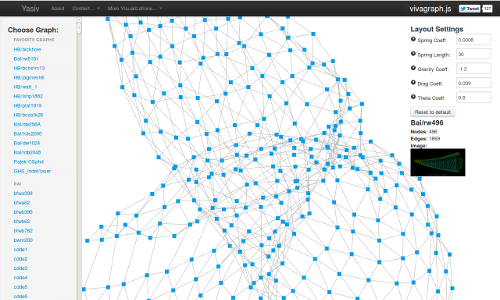
Vivagraph.js is a graphing JavaScript library designed for building network and node-based graphs. It supports different rendering formats for the graphs, including WebGL, SVG, and CSS-based layouts. This library is designed to support both small graphs with only a few nodes, to large graphs with hundreds or thousands. Continue reading…
Vivagraph.js Tutorials: Creating Node Network Graphs
Vivagraph Tutorials
These official examples show how to create node graphs with VivaGraph.js. Starting with creating a simple graph, then adding nodes and interactivity, these examples create a helpful starting point for working with Vivagraph.js
Visualizing the news with Vivagraph.js
This tutorial shows how to create an interactive node-based connection graphs using Vivagraph.js. It combines Vivagraph.js with a number of libraries, creating an interesting search-application. The tutorial is a bit complex and documentation is a bit sparse, but the idea is interesting and creates a useful, practical application.
Parallax Web Design
Parallax website design moves one part of your website at a different speed than the rest of your page. This often creates a 3D-like effect, adding depth and interest to your webpage design. The resources, including themes, tutorials, and examples, are designed to help you build a website with parallax scrolling.
Parallax Web Design Resources
Parallax Technologies
Tools to create parallax scrolling websites: jQuery, Skrollr.js, Stellar.js, CSS
Parallax Tutorials
A Simple Parallax Scrolling Tutorial about how parallax scrolling works.
Tutorials for creating parallax websites using: jQuery | Stellar.js | Skrollr.js | CSS
Infininite Scrolling Web Design
Build an endless scrolling website, loading new content when your visitors reach the end of your webpage.
Infinite Scroll Tutorials
Tutorials about how to build an infinite scrolling website, including: WordPress, Drupal, Blogger, jQuery, Jetpack, Masonry, Isotope, and the Infinite-Scroll plugin for WordPress.
Infinite Scroll, Card Design Tutorial
How to build an infinite scrolling website with card design using Masonry, AJAX, JavaScript, PHP, and MySQL.
Website Crawlers
Looking to download a lot of data? Need to find the exact information in a gigantic internet haystack that you are looking for? These resources are designed to help you build spiders, crawlers, and other tools to obtain data from the internet.
Website Crawler Tutorials
Build website spiders and crawlers using: Python | PHP | Java | Node.js | Scrapy | Cheerio | Apache Nutch | MongoDB | PhantomJS.
Website Tools
These tools are designed to help you build your website, add content, and improve your website’s appearance.
Javascript Graphing Libraries
Add charts & graphs to your website using: Chart.js | Chartist.js | DC.js | Morris.js | Timeline.js | Vivagraph.js
Node.js Tutorials
How to install, program for, and implement Node.js for scalable and easy server-side Javascript for quick AJAX-style processing.
Parallax Website Design Techniques
Create websites with parallax scrolling using: jQuery.js | Stellar.js | Skrollr.js | CSS
Reveal.js
Website Theme Resources
Website themes are an easy to create a great website quickly. They provide a beginning point for you to build your websites, giving you layout, code, and functionality to work with. These resources are made to help you find the right theme to help you start building your website.
Website Theme Research
Our comprehensive, analytical research into the website theme industry, focusing on trends and major changes affecting website designers and website theme customers.
Theme Forest Analysis Report
Our Fall, 2014 Theme Forest Analysis Report shows a major shift in the theme marketplace. The empirical assesment of Theme Forest over a 28 month period indicates a series of interesting trends and patterns.
Analysis of Parallax Scrolling in Website Themes
Our assement of the popularity of parallax scrolling in website themes published on Theme Forest shows that parallax design elements are an increasingly popular trend.
WordPress Themes
Top Ranked WordPress Themes
The best WordPress themes for a new website, as calculated by our WordPress Theme Search Engine. These themes are selected for reliability, quality, popularity, and many other factors.
Parallax WordPress Themes
Top Ranked Parallax WordPress Themes: the best WordPress themes for creating websites with parallax scrolling, as ranked by our WordPress Theme Search Engine
10 Parallax WooCommerce WordPress Themes
Amazing WordPress Themes with WooCommerce and Parallax Scrolling
7 Amazing Parallax WordPress Themes
5 Wonderful Parallax WordPress Themes
eCommerce WordPress Themes
Top Ranked eCommerce WordPress Themes: the best WordPress themes for creating eCommerce websites, as ranked by our WordPress Theme Search Engine
10 Parallax WooCommerce WordPress Themes
5 Great eCommerce Website Themes, Built For WordPress
6 Amazing WordPress eCommerce Themes
Finding WordPress & Drupal GPL Themes
How to find WordPress and Drupal themes licensed under the GNU Public License. These themes offer increased freedom and the ability to use your theme on multiple sites.
Drupal Themes
These themes are built for use with the Drupal content management system. Drupal is wonderful and quite popular for business websites.
Parallax Drupal Themes
Themes for creating parallax-scrolling 3D-depth-like effects and animations as visitors scroll down a page.
6 Professional Parallax Drupal Themes
Portfolio Drupal Themes
Themes built for making professionally designed portfolios.
5 Professional Drupal Portfolio Themes
5 Amazing Drupal Portfolio Themes
Corporate Drupal Themes
Themes built for making small, medium, and large business websites.