
Vivagraph.js: A Node Network Graphing Library
Node Network Graphs with Vivagraph.js
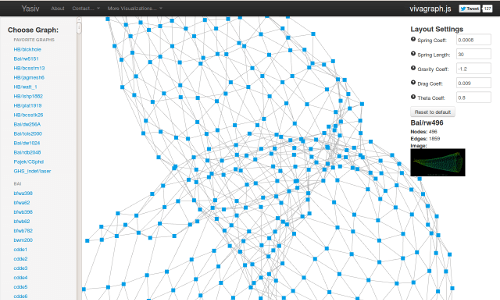
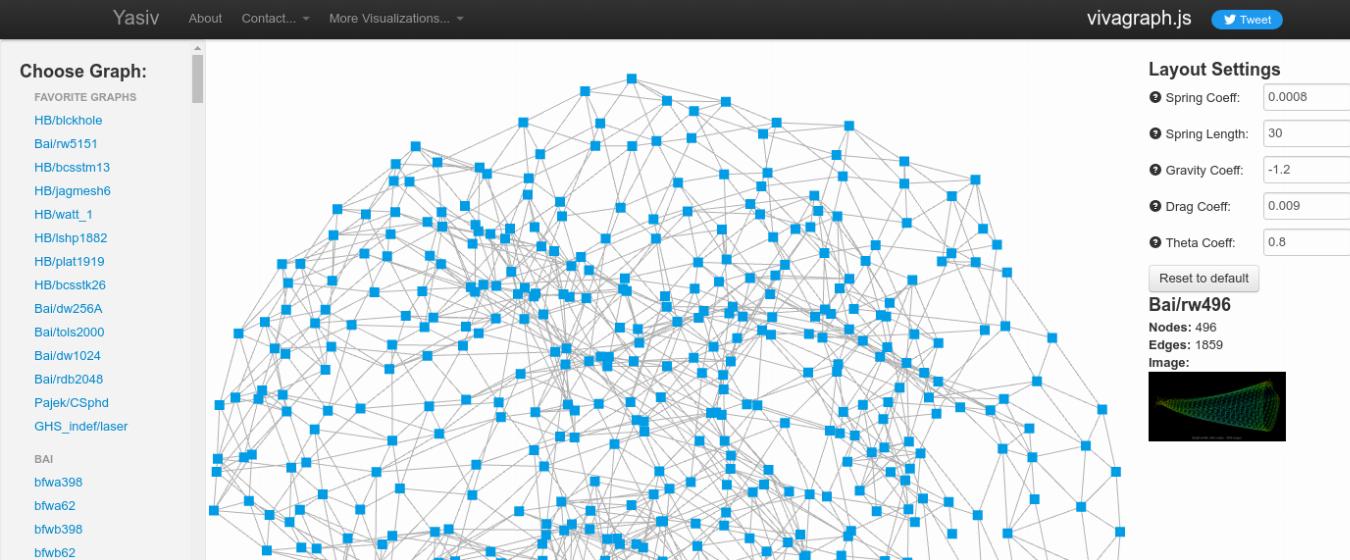
Vivagraph.js is a graphing JavaScript library designed for building network and node-based graphs. It supports different rendering formats for the graphs, including WebGL, SVG, and CSS-based layouts. This library is designed to support both small graphs with only a few nodes, to large graphs with hundreds or thousands.
Nodes and links in graphs created by Vivagraph.js are easily modifiable using CSS and library settings. The graph also supports multiple algorithms for arranging networks of nodes.
Vivagraph.js Tutorials: Creating Node Network Graphs
Vivagraph Tutorials
These official examples show how to create node graphs with VivaGraph.js. Starting with creating a simple graph, then adding nodes and interactivity, these examples create a helpful starting point for working with Vivagraph.js

Visualizing the news with Vivagraph.js
This tutorial shows how to create an interactive node-based connection graphs using Vivagraph.js. It combines Vivagraph.js with a number of libraries, creating an interesting search-application. The tutorial is a bit complex and documentation is a bit sparse, but the idea is interesting and creates a useful, practical application.
A Quick Tutorial on Using Vivagraph.js
The Basic Setup
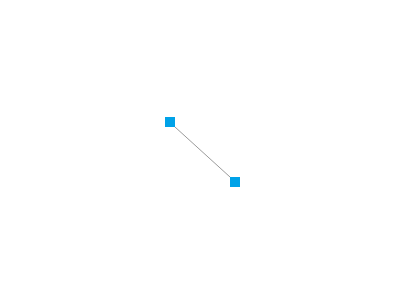
To use vivagraph, we’ll create a simple function called loadGraph(). This function will initiate a vivagraph graph object and render it.
It’s important to remember to size the svg object so that the graph will be displayed on the page.
<!DOCTYPE html>
<html lang="en">
<head>
    <meta charset="UTF-8">
    <meta name="viewport" content="width=device-width, initial-scale=1.0">
    <title>VivaGraph Example</title>
    <style>
        html, body, svg {
            width: 100%;
            height: 100%;
            margin: 0;
            padding: 0;
        }
    </style>
</head>
<body onload="loadGraph()">

<script src="https://cdn.rawgit.com/anvaka/VivaGraphJS/v0.9.0/dist/vivagraph.js"></script>

<script type="text/javascript">
    var renderer;

    function loadGraph() {
        // Create a graph instance:
        var graph = Viva.Graph.graph();

        // Populate the graph with some nodes and links:
        graph.addNode('1', 'Node #1');
        graph.addNode('2', 'Node #2');
        graph.addLink('1', '2');

        // Set up the graphics and the renderer:
        var graphics = Viva.Graph.View.svgGraphics();
        renderer = Viva.Graph.View.renderer(graph, {
            graphics: graphics
        });

        // Render the graph:
        renderer.run();
    }
</script>

</body>
</html>
Adding a Reset Button
It’s easy to add a reset button to your graph. It’s easy, just call the renderer.reset(); function.
<!DOCTYPE html>
<html lang="en">
<head>
    <meta charset="UTF-8">
    <meta name="viewport" content="width=device-width, initial-scale=1.0">
    <title>VivaGraph Example</title>
    <style>
        html, body, svg {
            width: 100%;
            height: 100%;
            margin: 0;
            padding: 0;
        }
        #resetButton {
            position: absolute;
            top: 10px;
            right: 10px;
        }
    </style>
</head>
<body onload="loadGraph()">

<button id="resetButton" onclick="resetGraph()">Reset</button>

<script src="https://cdn.rawgit.com/anvaka/VivaGraphJS/v0.9.0/dist/vivagraph.js"></script>

<script type="text/javascript">
    var renderer;

    function loadGraph() {
        // Create a graph instance:
        var graph = Viva.Graph.graph();

        // Populate the graph with some nodes and links:
        graph.addNode('1', 'Node #1');
        graph.addNode('2', 'Node #2');
        graph.addLink('1', '2');

        // Set up the graphics and the renderer:
        var graphics = Viva.Graph.View.svgGraphics();
        renderer = Viva.Graph.View.renderer(graph, {
            graphics: graphics
        });

        // Render the graph:
        renderer.run();
    }

    function resetGraph() {
        if (renderer) {
            renderer.reset();
        }
    }
</script>

</body>
</html>
Adding Images to the Nodes

It’s also easy to add images to your nodes. To do this, you’ll want to create a custom graphics rendering function, in this case:
graphics.node(function(node) {
            var ui = Viva.Graph.svg('image')
               .attr('width', 100)
               .attr('height', 100)
               .link(node.data.url);
            return ui;
        });
From this, we’ll want to add images to our nodes:
        // Populate the graph with some nodes and links:
        graph.addNode('1', { url: 'https://potentpages.com/wp-content/uploads/2020/07/potentpages.jpg' });
        graph.addNode('2', { url: 'https://dseldentreiman.com/wp-content/uploads/2023/09/dseldentreiman_profile_image.jpg' });
        graph.addLink('1', '2');
Here’s the full code:
<!DOCTYPE html>
<html lang="en">
<head>
    <meta charset="UTF-8">
    <meta name="viewport" content="width=device-width, initial-scale=1.0">
    <title>VivaGraph Example</title>
    <style>
        html, body, svg {
            width: 100%;
            height: 100%;
            margin: 0;
            padding: 0;
        }
        #resetButton {
            position: absolute;
            top: 10px;
            right: 10px;
        }
    </style>
</head>
<body onload="loadGraph()">

<button id="resetButton" onclick="resetGraph()">Reset</button>

<script src="https://cdn.rawgit.com/anvaka/VivaGraphJS/v0.9.0/dist/vivagraph.js"></script>

<script type="text/javascript">
    var renderer;

    function loadGraph() {
        // Create a graph instance:
        var graph = Viva.Graph.graph();

        // Populate the graph with some nodes and links:
        graph.addNode('1', { url: 'https://potentpages.com/wp-content/uploads/2020/07/potentpages.jpg' });
        graph.addNode('2', { url: 'https://dseldentreiman.com/wp-content/uploads/2023/09/dseldentreiman_profile_image.jpg' });
        graph.addLink('1', '2');

        // Set up the graphics and the renderer:
        var graphics = Viva.Graph.View.svgGraphics();

        graphics.node(function(node) {
            var ui = Viva.Graph.svg('image')
               .attr('width', 100)
               .attr('height', 100)
               .link(node.data.url);
            return ui;
        });

        renderer = Viva.Graph.View.renderer(graph, {
            graphics: graphics
        });

        // Render the graph:
        renderer.run();
    }

    function resetGraph() {
        if (renderer) {
            renderer.reset();
        }
    }
</script>

</body>
</html>